AgencyAnalytics Client Performance KPIs Table
Overview
Highlights
Introduction
AgencyAnalytics is a reporting and dashboarding tool designed for digital marketing agencies. It enables agencies to connect client accounts, automate reporting, and track marketing performance across multiple channels. This project focused on enhancing the client experience by introducing a Performance KPIs Table. The goal was to provide a consolidated view of key client metrics in a single, easy-to-navigate table, allowing analysts to quickly compare performance, identify trends, and make faster, data-driven decisions.
Design Process
The redesign process began with a collaborative workshop involving AgencyAnalytics stakeholders, Product Manager, Me and customers
Customer Feedback (User Interviews)
To kick off the design process, I worked with the Product Manager to review customer feedback and conducted user interviews to better understand their needs.
- Users were manually creating performance tables in Google Sheets, which was time-consuming and inefficient.
- Users wanted to see important KPIs in one table, especially from ad-related integrations like Google Ads, Meta Ads, LinkedIn Ads, TikTok Ads, and more.
- Users asked for the ability to aggregate data across the client level — for example, viewing the total ad spend across all ad platforms.
- Users also wanted to group clients together and see aggregated KPIs for each group, making it easier to organize and analyze related clients.
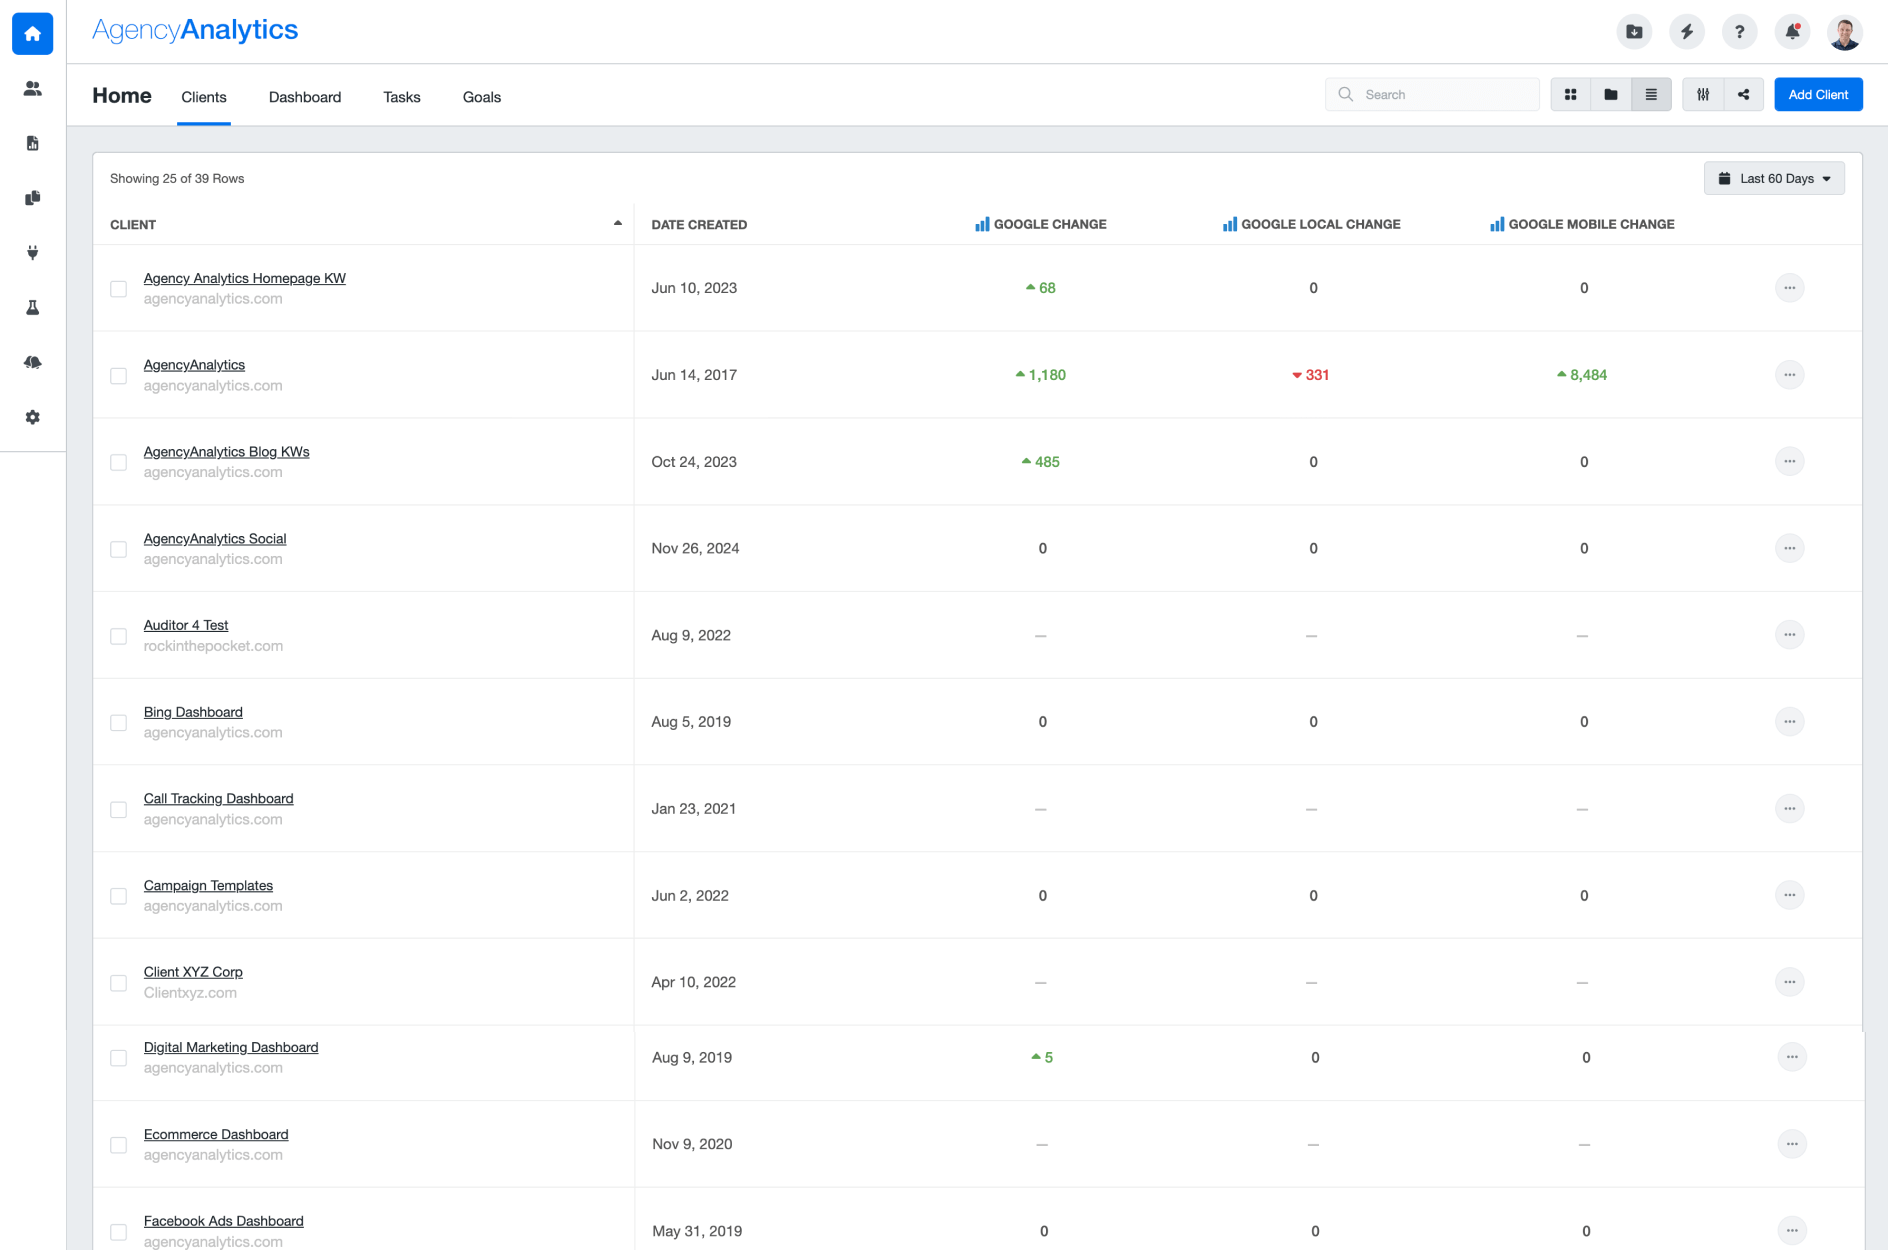
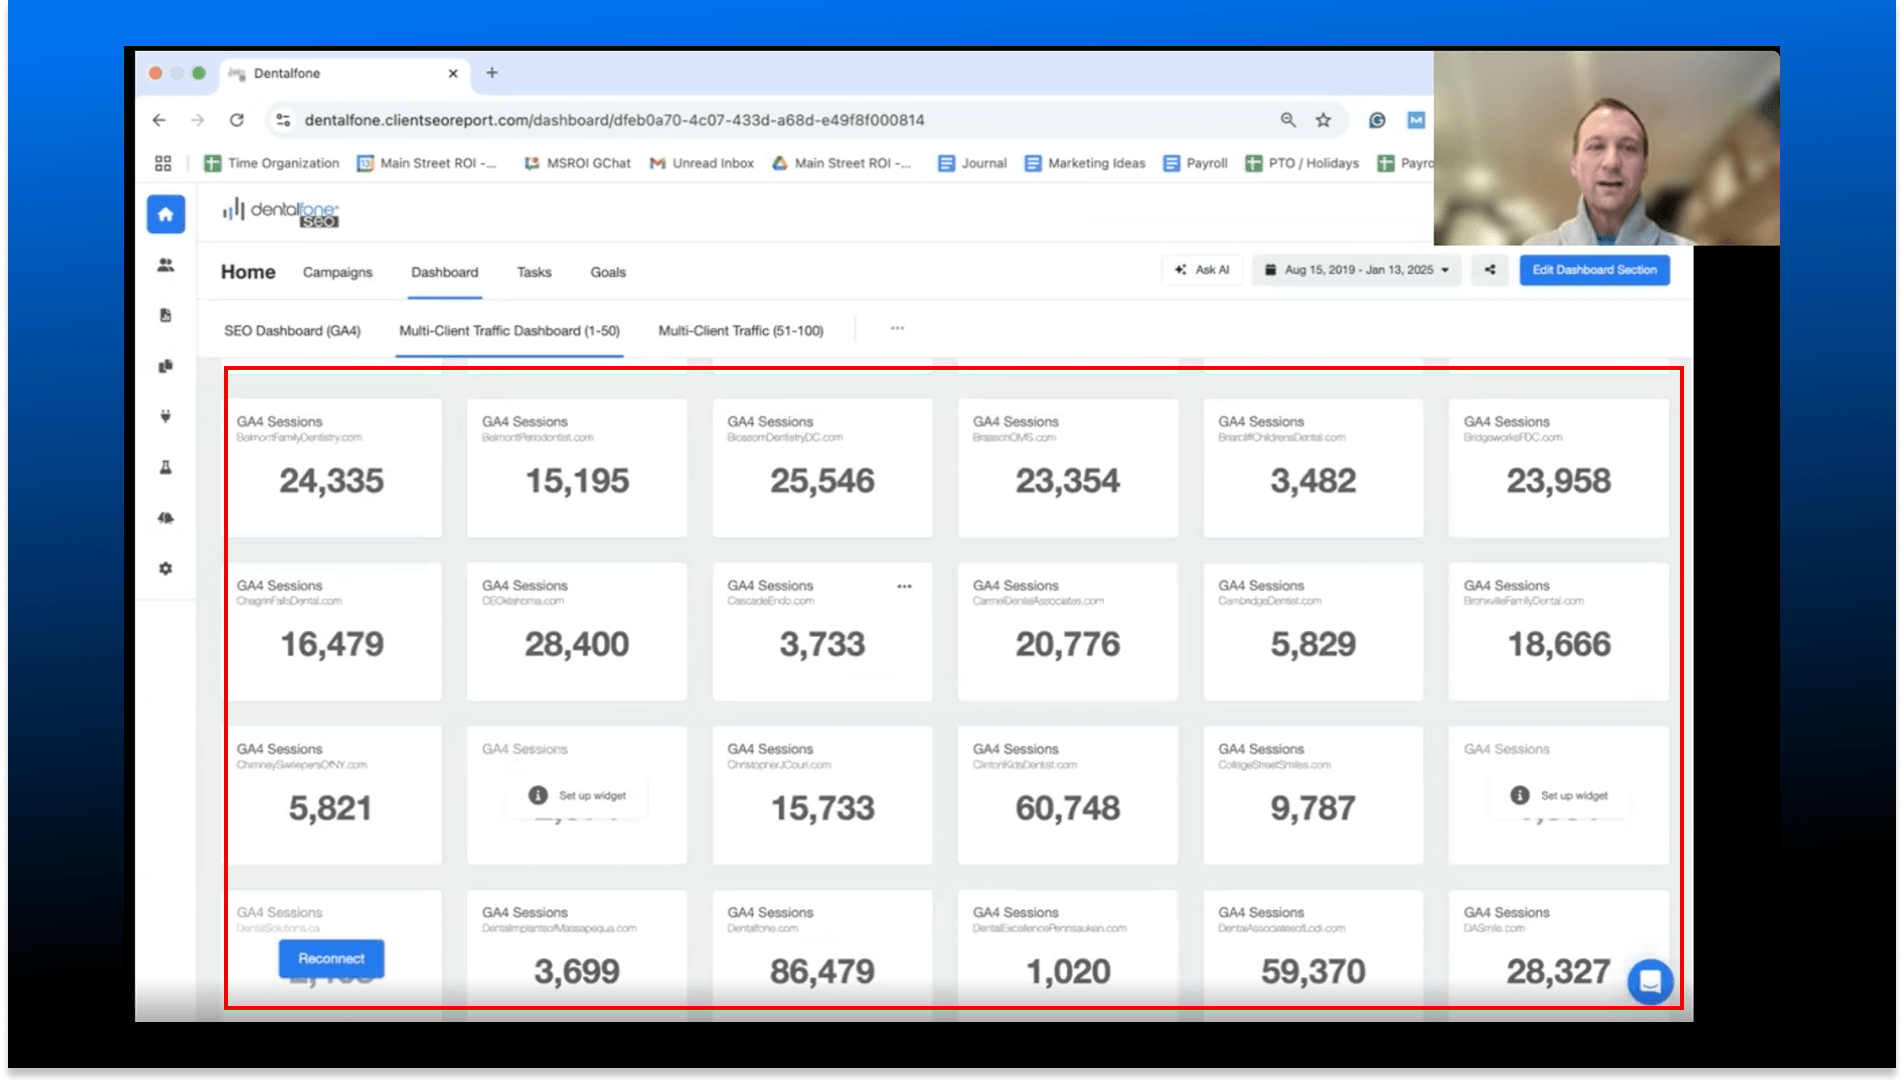
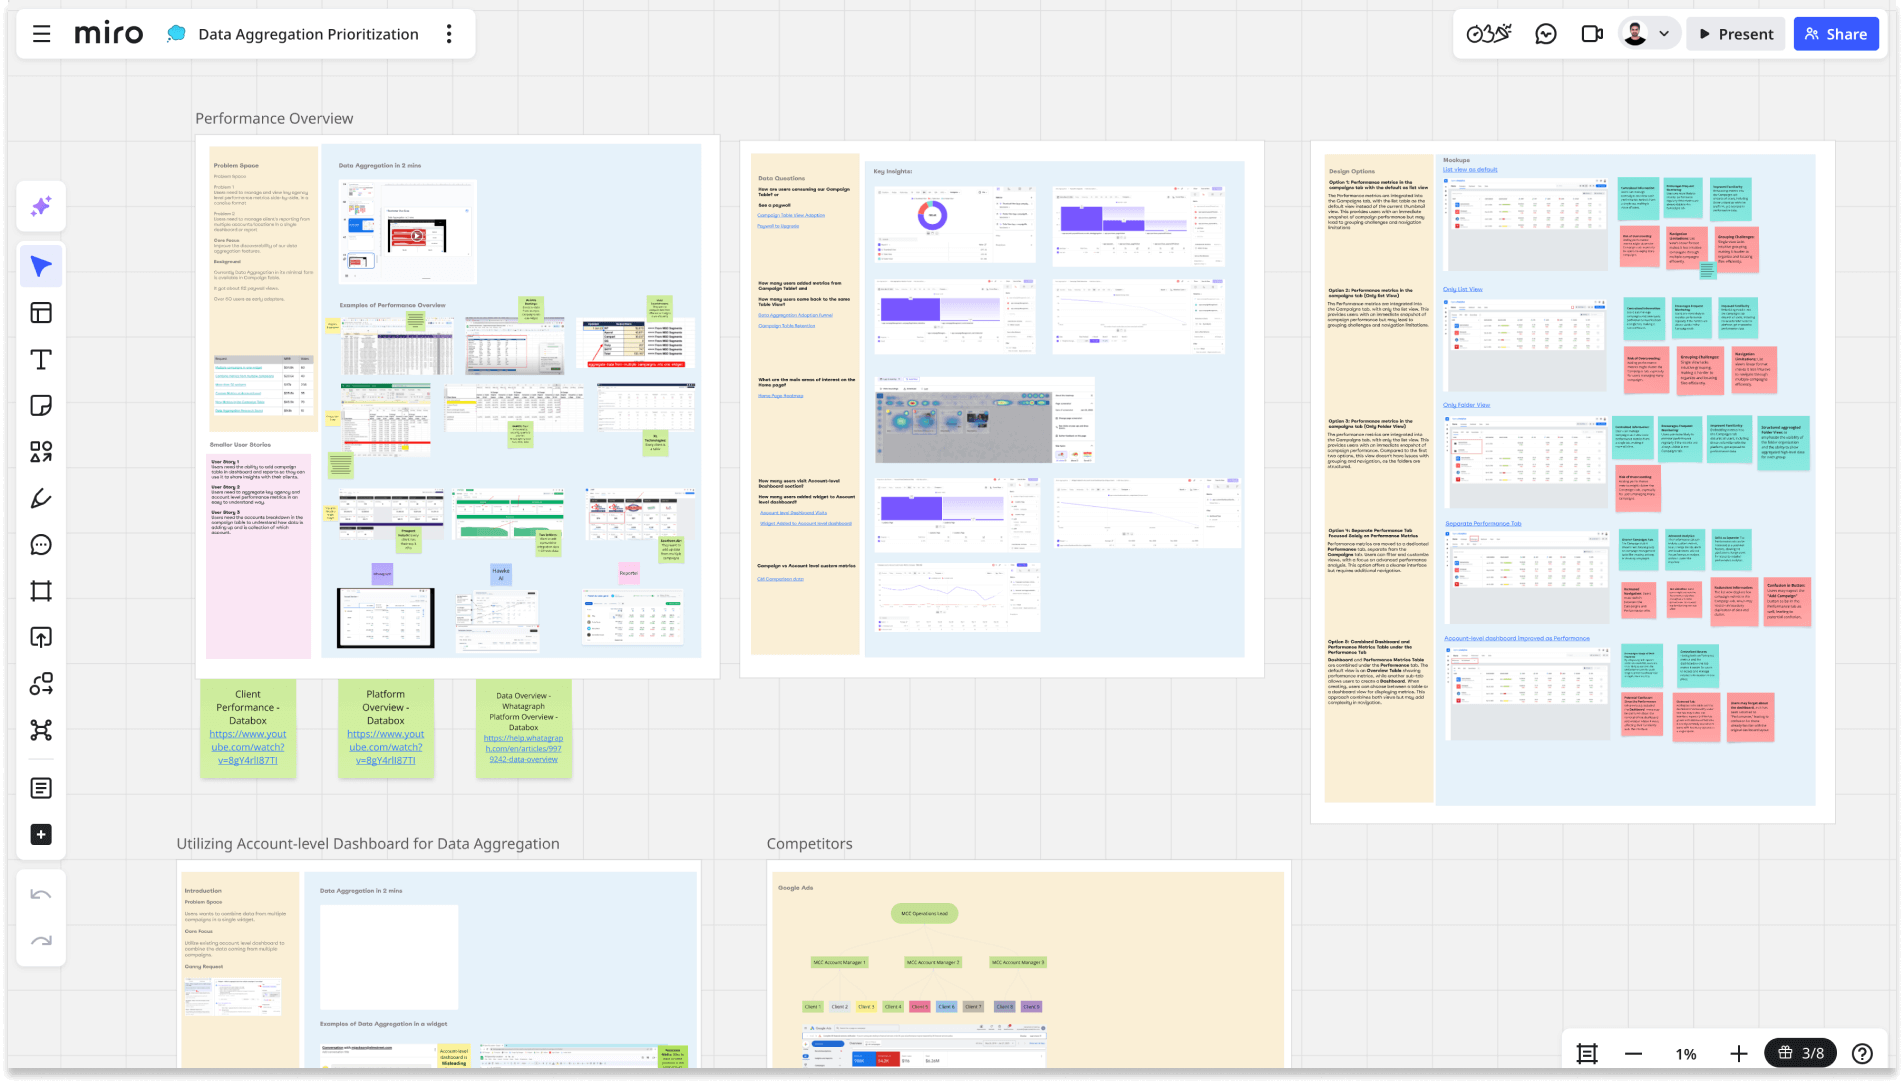
- Users are currently doing metrics comparisons in the multi-client dashboards, which is a manual and time-consuming process(see the image below)
Insights Learned (Interal Analytics)
We gathered insights from Mixpanel on how users were interacting with the current client page. Here’s what we learned:
- Users rarely switched to the list view and mostly used the default thumbnail (tile) view.
- In the list view, users were less likely to add or customize the available metrics.
Key Goals
Over weeks of discussions with customers and after gathering insights, we defined the key goals for the project:
- Set the list view as the default, giving more focus by showing important KPIs, especially from PPC integrations.
- Add the ability to show a Total row at the bottom of the table, summing each metric across all clients.
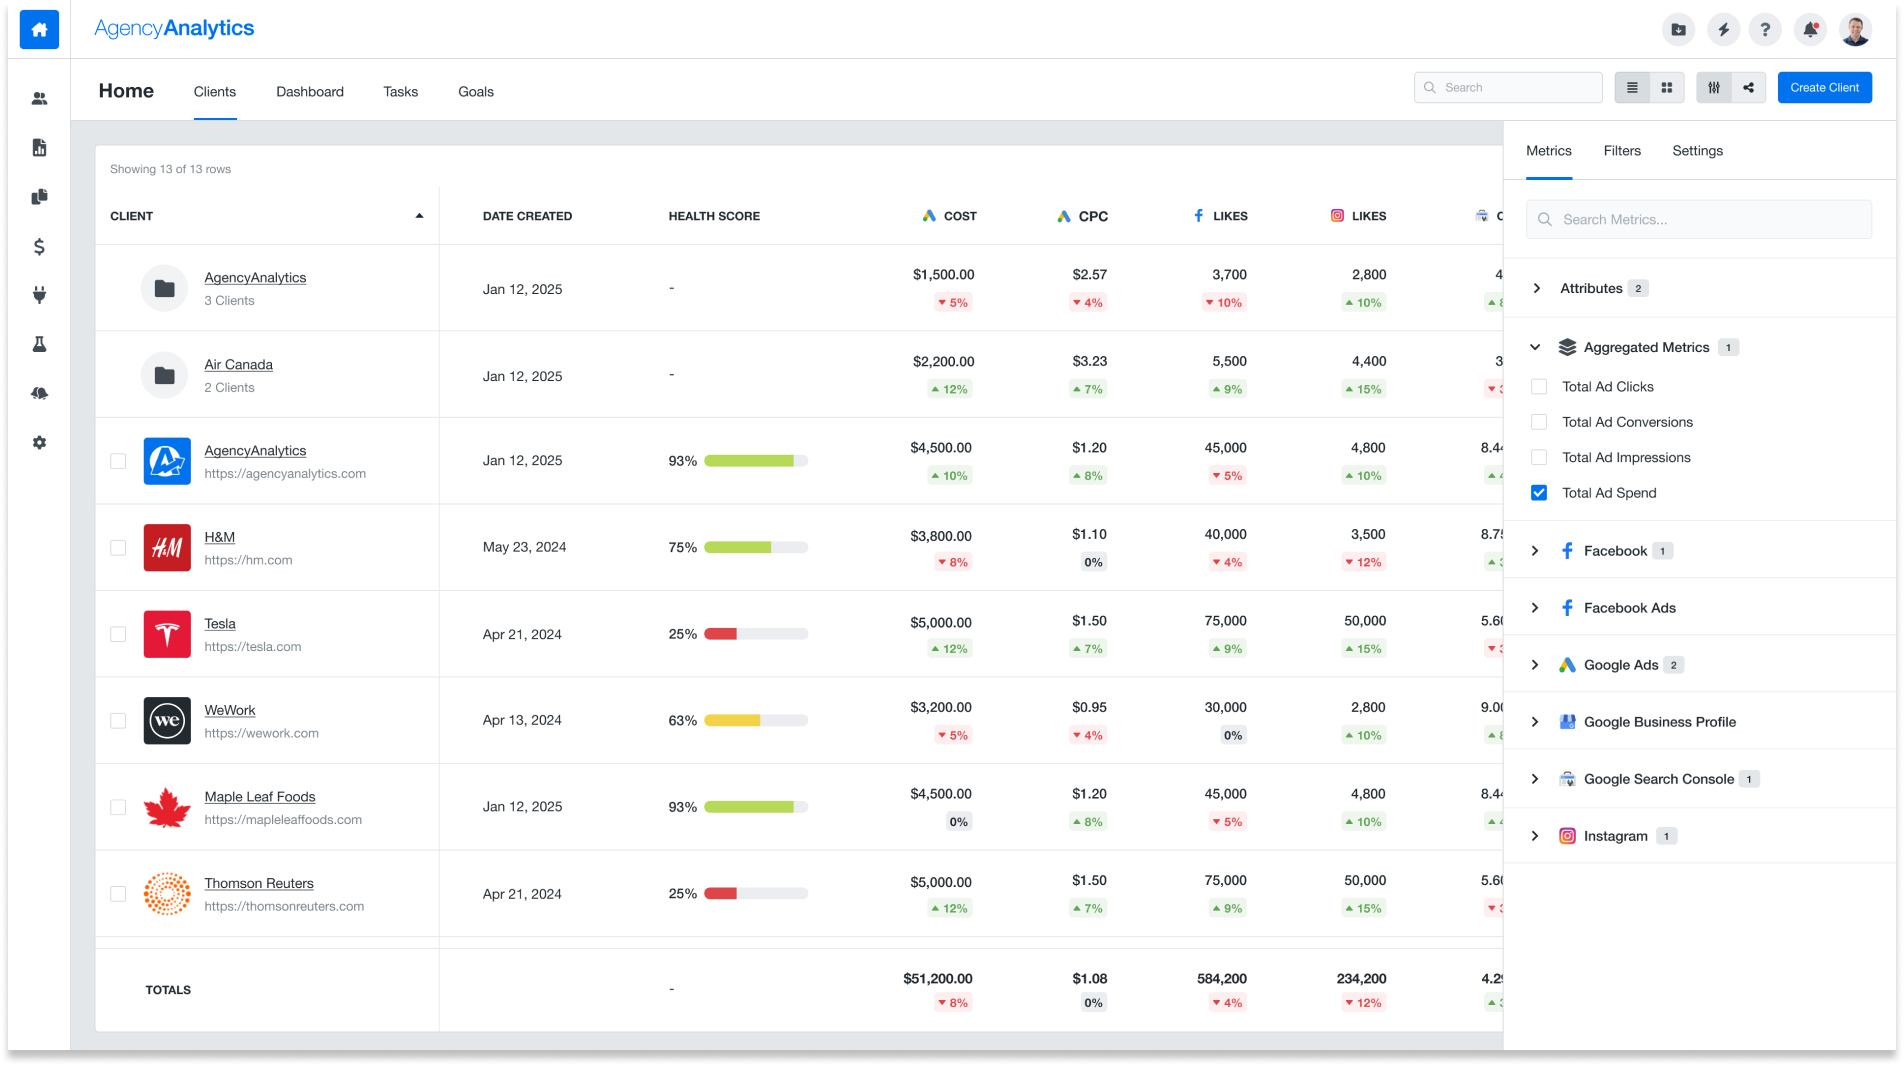
- Include the most needed pre-calculated metrics such as Total Ad Spend, Total Ad Clicks, Total Ad Impressions, and Total Ad Conversions.
- Paywall the important metrics for freelancer users, so we can encourage upgrades to Agency and Enterprise plans and drive more conversions.
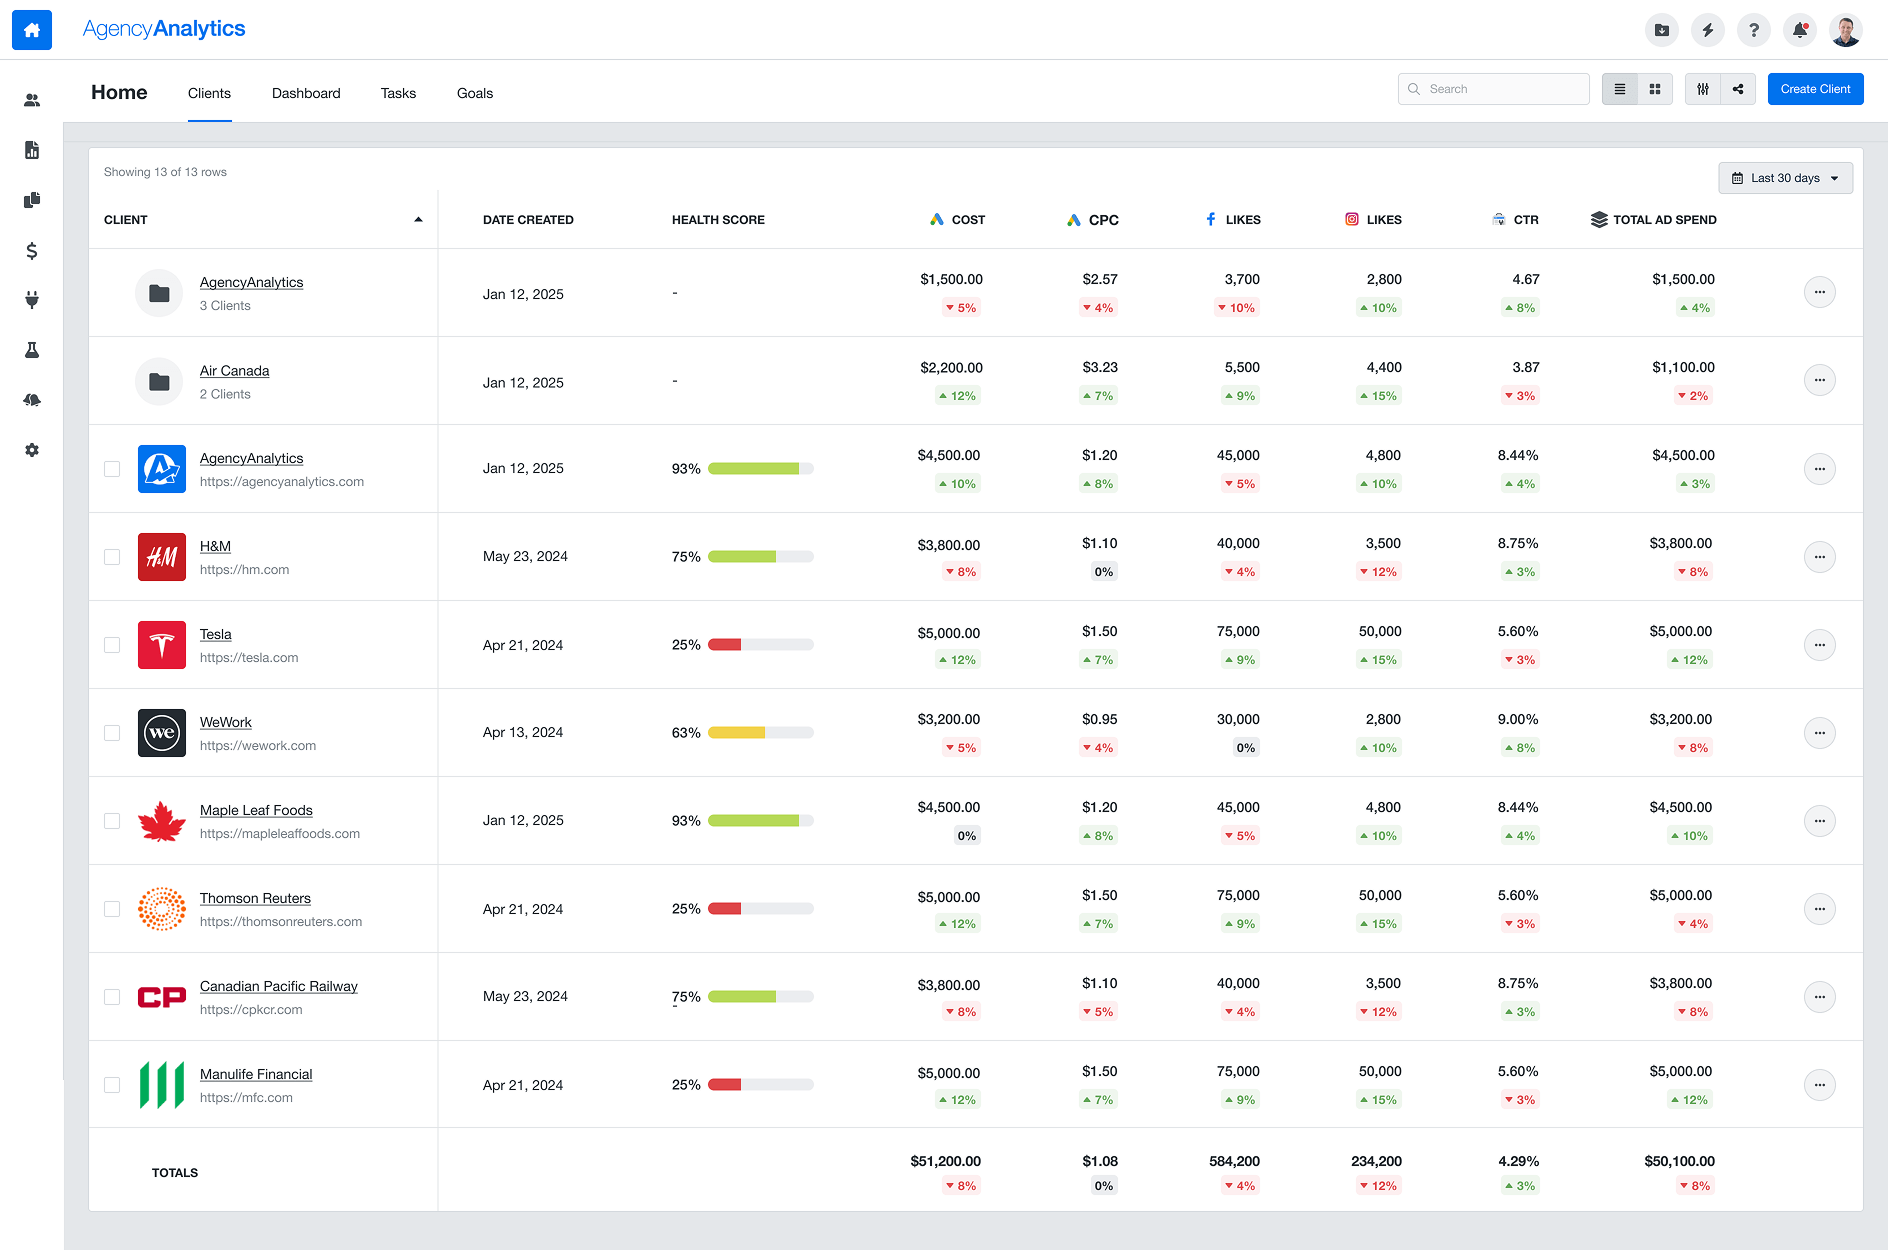
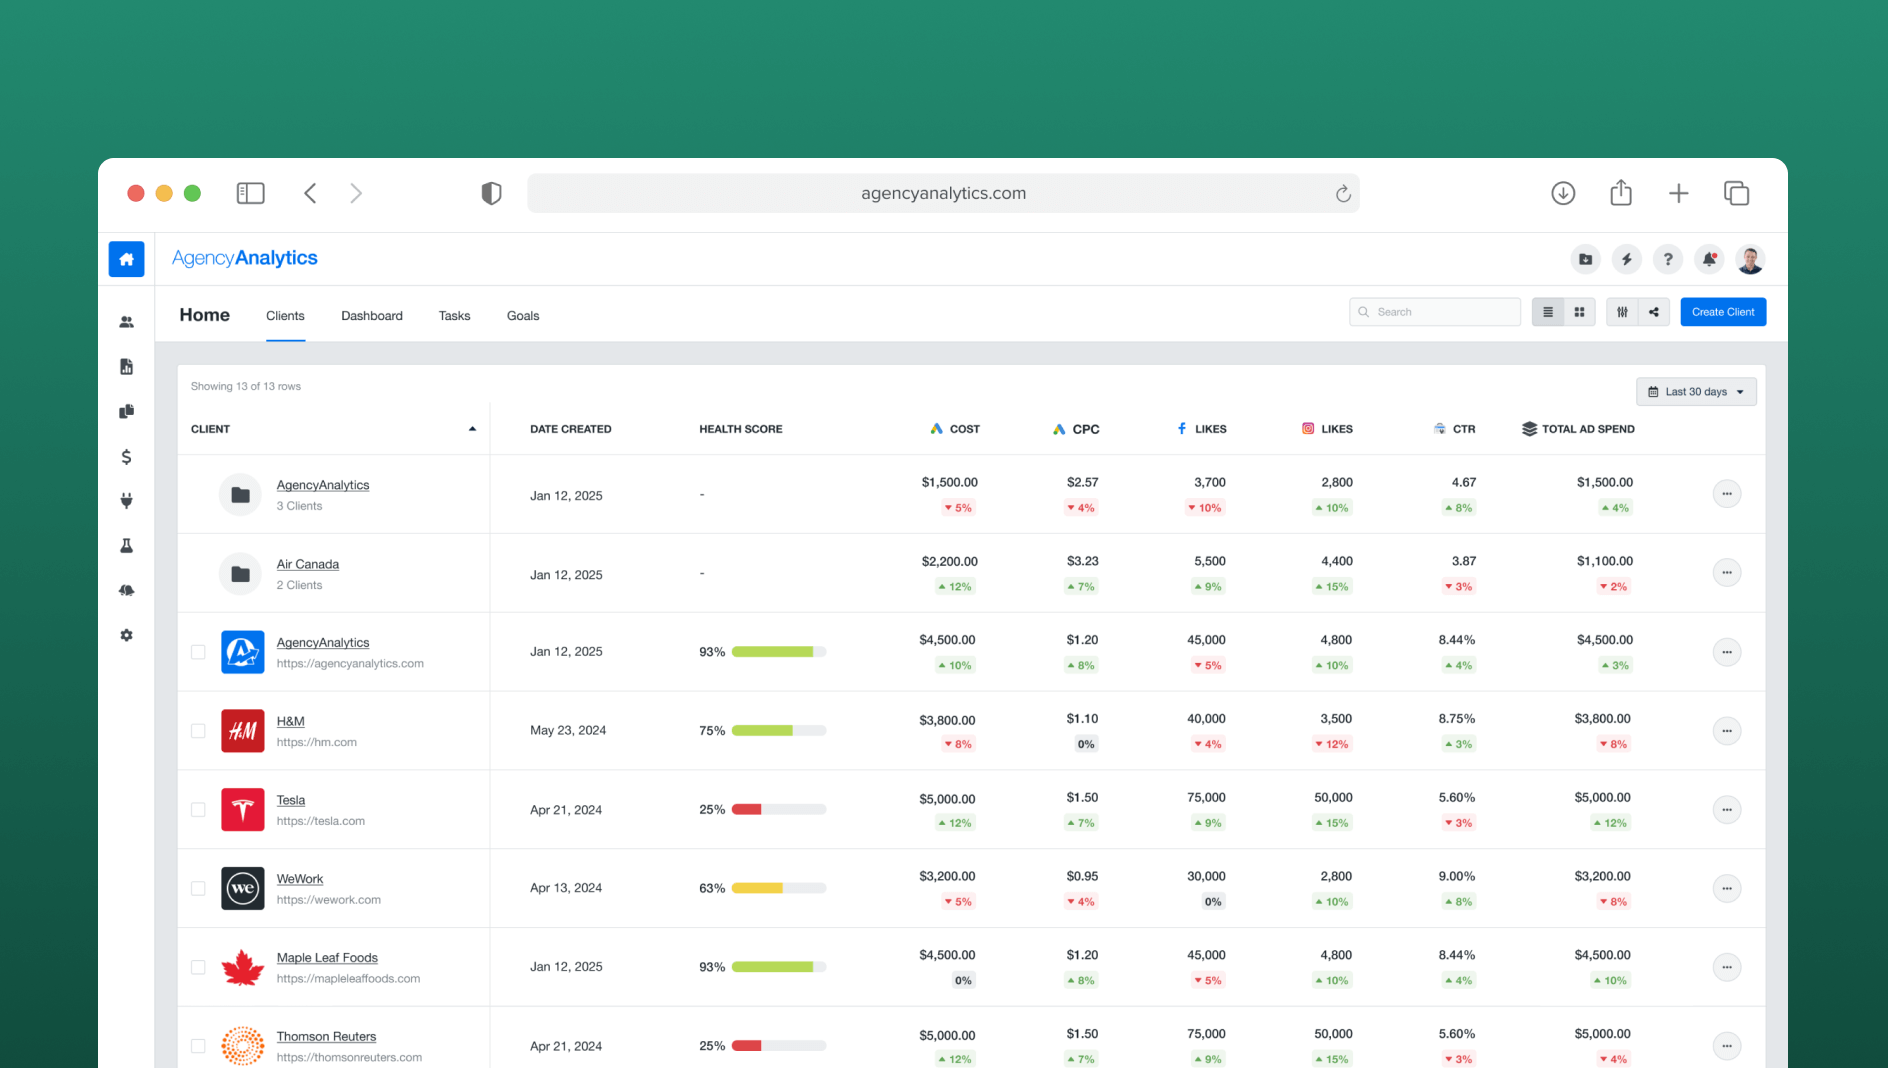
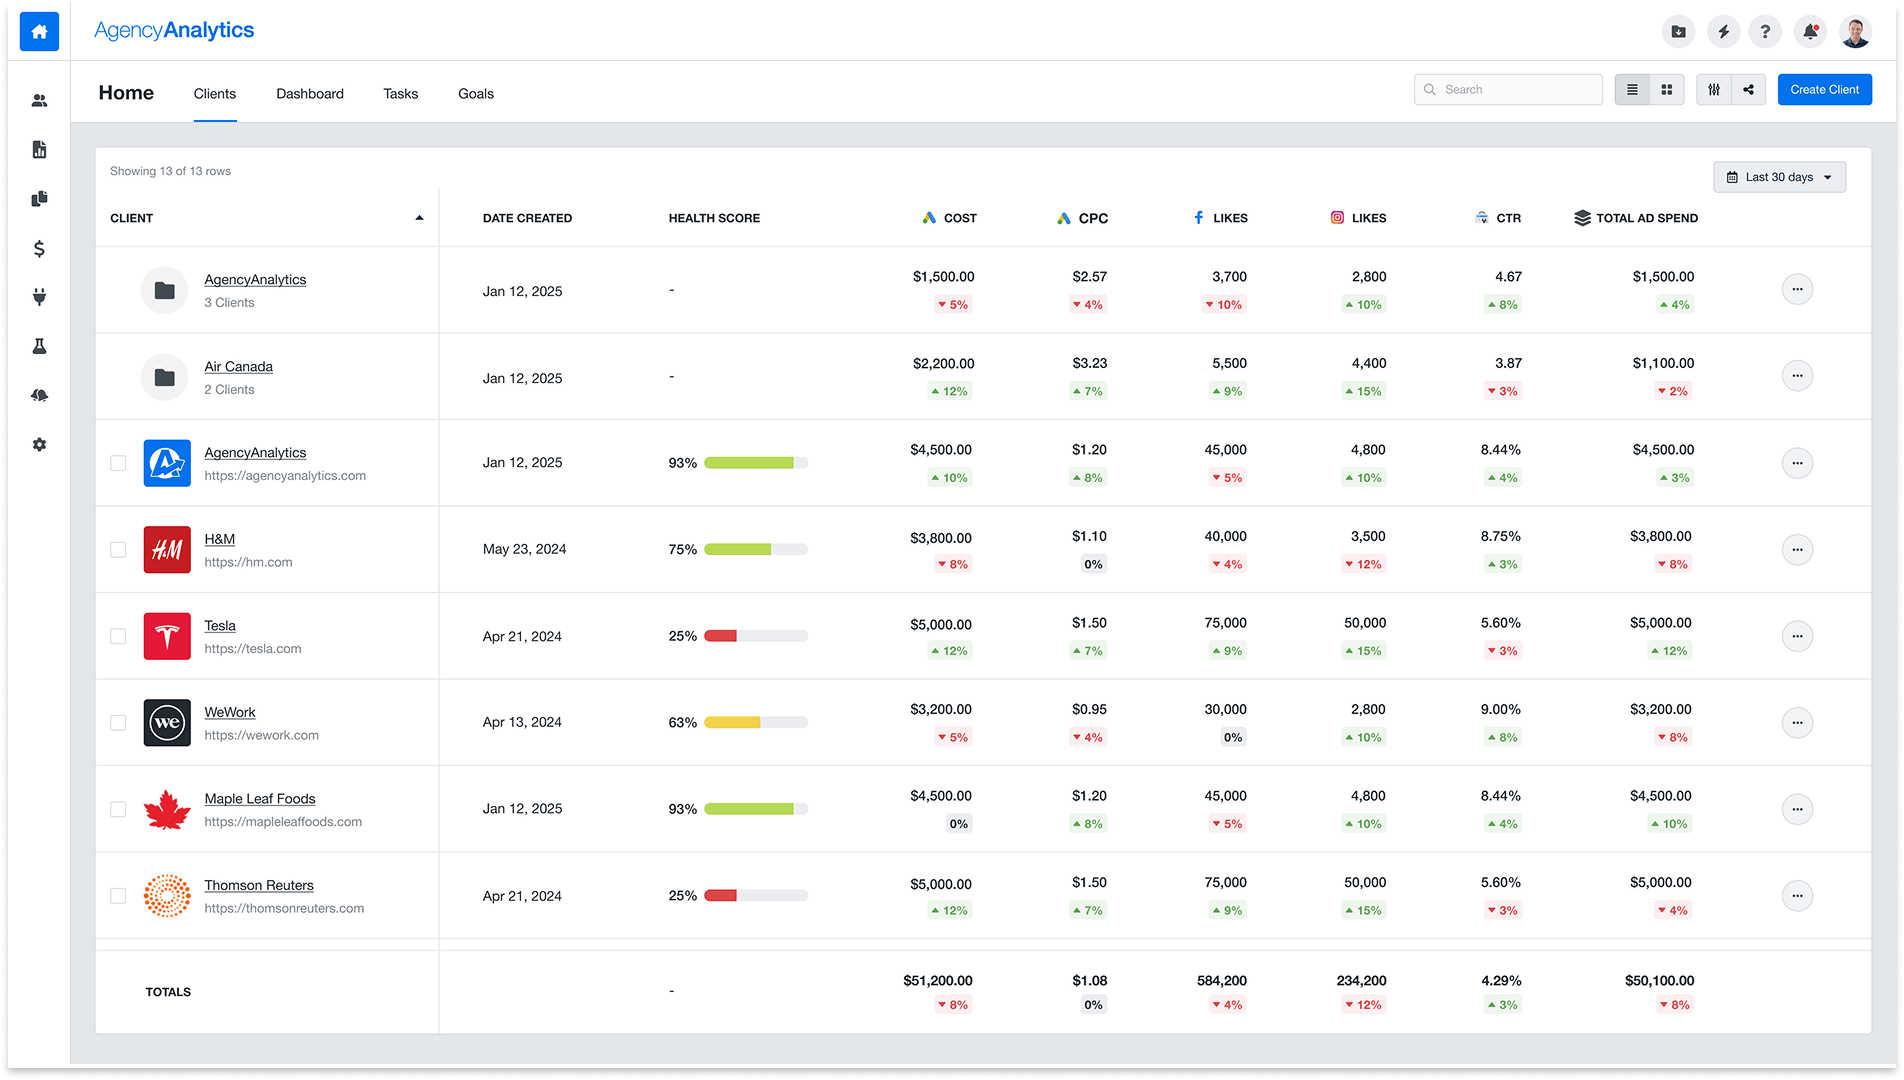
Final Screens
Here are the final screens of the new Clients page, featuring the important KPIs listed directly in the table. The new design allows users to easily view, compare, and analyze key performance metrics across all clients at a glance.
Usability Testing
Before launching, we conducted moderated usability testing with real customers. We asked them to complete key tasks, such as:
- Adding a metric using the Metric Explorer
- Navigating the new Clients table
- Viewing and understanding the Total row and important KPIs
Having a total row saves me a lot of time. I don't have to export to a spreadsheet anymore.- Aaron Bunner, Digital Marketing Manager
The list view makes way more sense for performance tracking. I’m glad it’s the default now- Bjorn Engels, Senior Analyst
It’s really helpful to see ad spend, clicks, and conversions directly without extra setup- Lucas Hernandez., Paid Media Manager
The feedback was positive — users found it easy to add metrics, navigate the table, and understand the aggregated data.
Results
After the launch, we saw a major improvement in how users tracked client performance. Without needing manual spreadsheet setups, users could instantly view key metrics in the new Clients table.
The simplified experience saved users hours every week and made analyzing client data much faster and easier.
We also observed an increase in paywall conversions, as many freelancer users upgraded their plans to access the advanced KPIs.